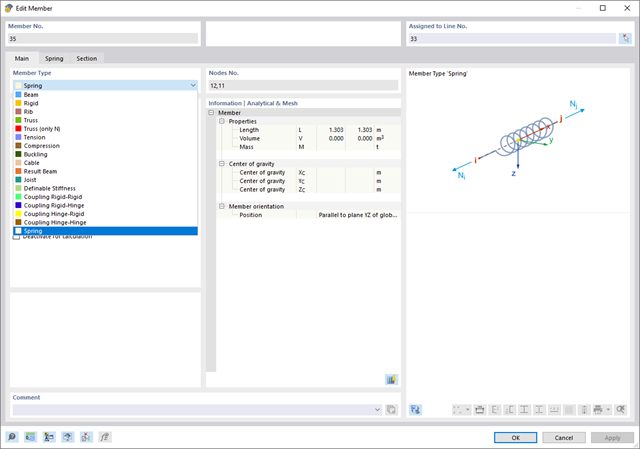
The "Spring" member type is used to simulate linear and nonlinear spring properties via a linear object. This input function helps you to model the stiffness specifications in the force/displacement unit.
Go to Explanatory Video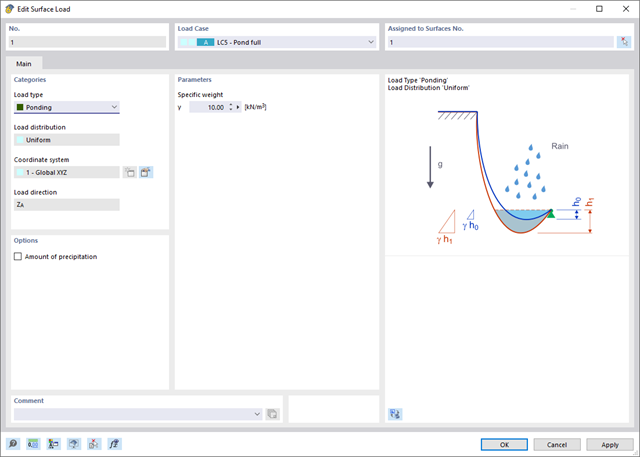
The Ponding load type allows you to simulate rain actions on multi-curved surfaces, taking into account the displacements according to the large deformation analysis.
This numerical rainfall process examines the assigned surface geometry and determines which rainfall portions drain away and which rainfall portions accumulate in puddles (water pockets) on the surface. The puddle size then results in a corresponding vertical load for the structural analysis.
For example, you can use this feature in the analysis of approximately horizontal membrane roof geometries subjected to rain loading.
Go to Explanatory Video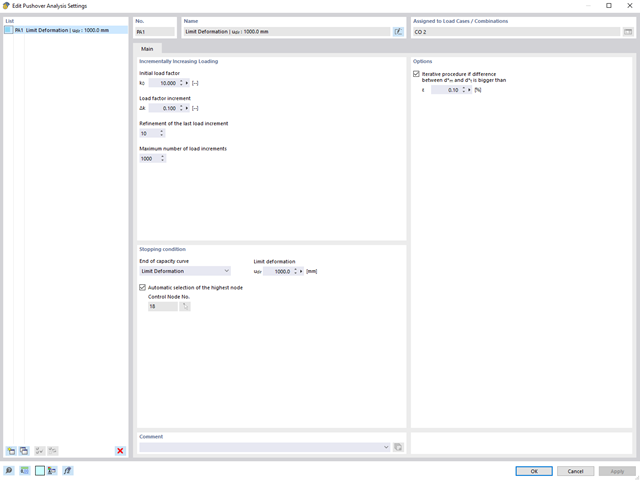
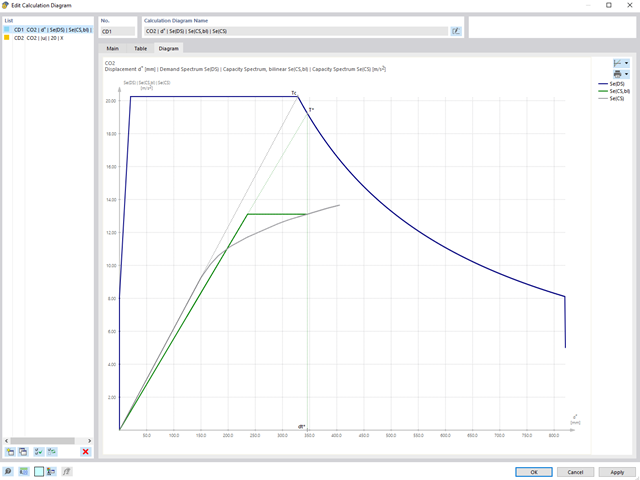
The pushover analysis is managed by a newly introduced analysis type in the load combinations. Here, you have access to the selection of the horizontal load distribution and direction, the selection of a constant load, the selection of the desired response spectrum for the determination of the target displacement, and the pushover analysis settings tailored to the pushover analysis.
In the pushover analysis settings, you can modify the increment of the increasing horizontal load and specify the stopping condition for the analysis. Furthermore, it is possible to easily adjust the precision for the iterative determination of the target displacement.
- Consideration of nonlinear component behavior using plastic standard hinges for steel (FEMA 356, EN 1998‑3) and nonlinear material behavior (masonry, steel - bilinear, user-defined working curves)
- Direct import of masses from load cases or combinations for the application of constant vertical loads
- User-defined specifications for the consideration of horizontal loads (standardized to a mode shape or uniformly distributed over the height of the masses)
- Determination of a pushover curve with selectable limit criterion of the calculation (a collapse or limit deformation)
- Transformation of the pushover curve into the capacity spectrum (ADRS format, single degree of freedom system)
- Bilinearization of the capacity spectrum according to EN 1998‑1:2010 + A1:2013
- Transformation of the applied response spectrum into the required spectrum (ADRS format)
- Determination of target displacement according to EC 8 (the N2 method according to Fajfar 2000)
- Graphical comparison of the capacity and required spectrum
- Graphical evaluation of the acceptance criteria of predefined plastic hinges
- Result display of the values used in the iterative calculation of the target displacement
- Access to all results of the structural analysis in the individual load levels
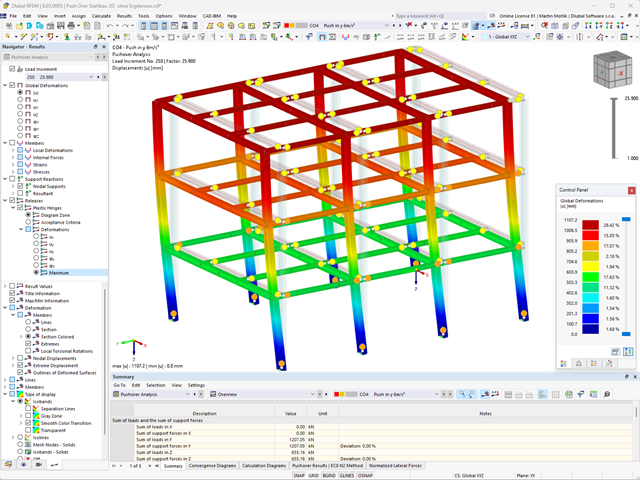
During the calculation, the selected horizontal load is increased in load steps. A static nonlinear analysis is carried out for each load step until reaching the specified limit condition.
The results of the pushover analysis are extensive. On one hand, the structure is analyzed for its deformation behavior. This can be represented by a force-deformation line of the system (a capacity curve). On the other hand, the response spectrum effect can be displayed in the ADRS display (Acceleration-Displacement Response Spectrum). The target displacement is automatically determined in the program based on these two results. The process can be evaluated graphically and in tables.
The individual acceptance criteria can then be graphically evaluated and assessed (for the next load step of the target displacement, but also for all other load steps). The results of the static analysis are also available for the individual load steps.
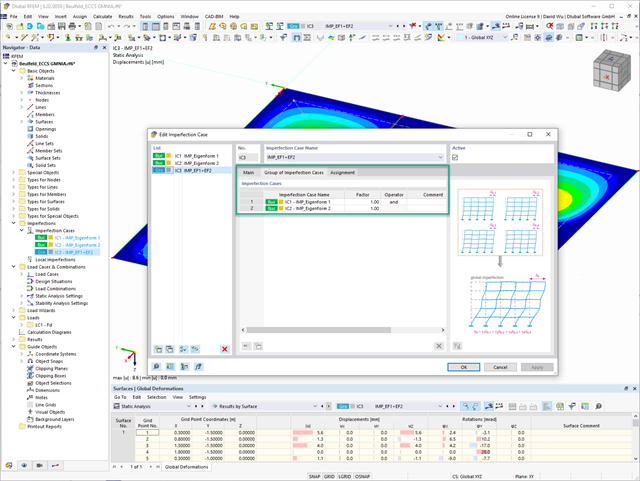
In the "Group of Imperfection Cases" imperfection case, you can enter several geometric imperfection cases. This allows you to carry out GMNIA analyses where several geometric imperfections have to be superimposed.
Go to Explanatory Video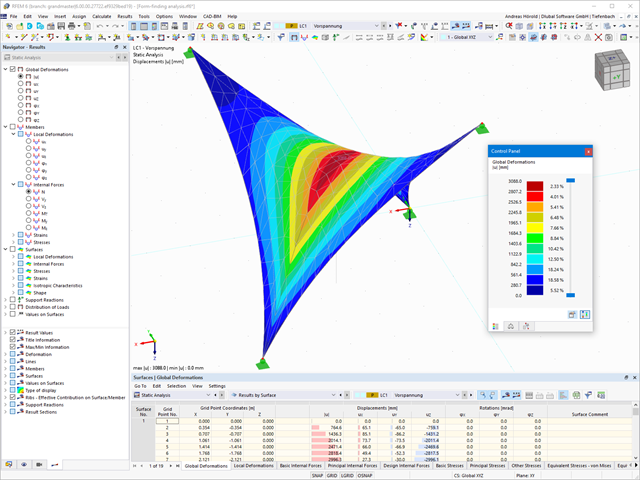
The form-finding process gives you a structural model with active forces in the "prestress load case" This load case shows the displacement from the initial input position to the form-found geometry in the deformation results. In the force or stress-based results (member and surface internal forces, solid stresses, gas pressures, and so on), it clarifies the state for maintaining the found form. For the analysis of the shape geometry, the program offers you a two-dimensional contour line plot with the output of the absolute height and an inclination plot for the visualization of the slope situation.
Now, a further calculation and structural analysis of the entire model is performed. For this purpose, the program transfers the form-found geometry including the element-wise strains into a universally applicable initial state. You can now use it in the load cases and load combinations.
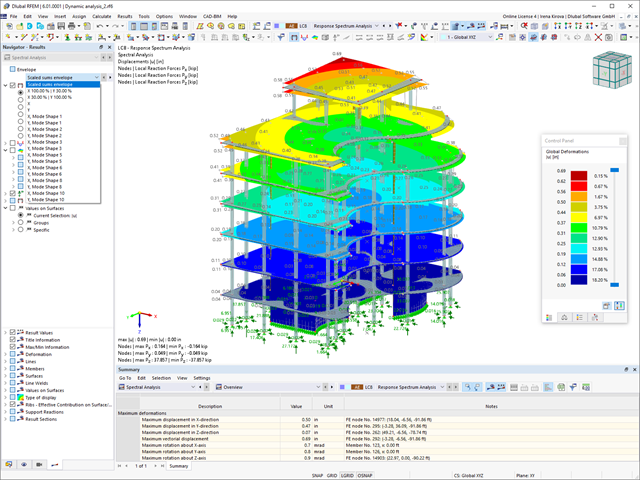
The load cases of the type Response Spectrum Analysis contain the generated equivalent loads. First, the modal contributions have to be superimposed with the SRSS or CQC rule. In this case, you can use the signed results based on the dominant mode shape.
Afterwards, the directional components of earthquake actions are combined with the SRSS or the 100% / 30% rule.
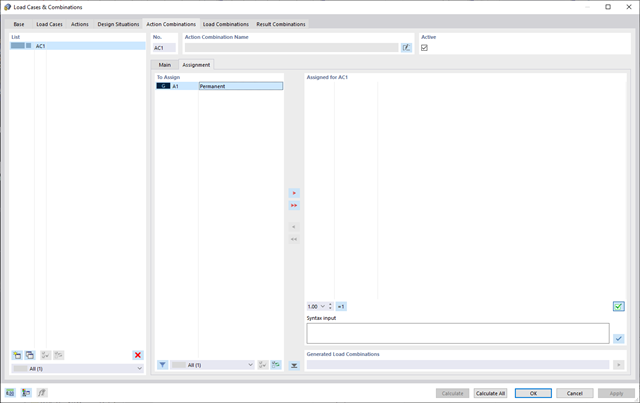
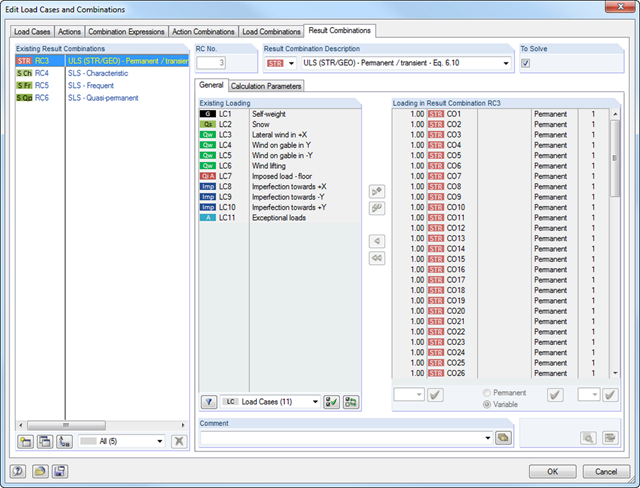
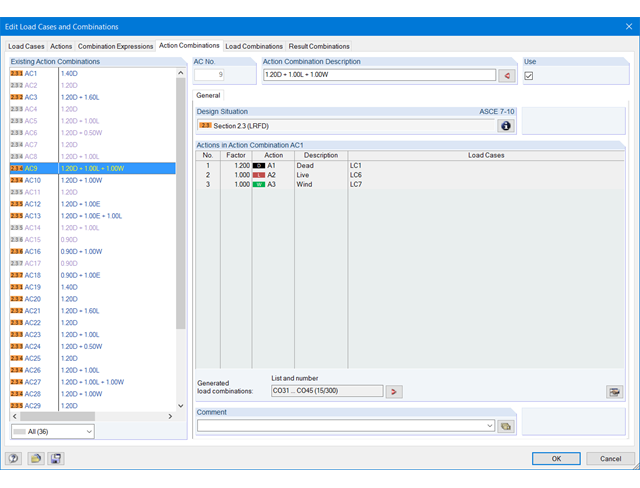
Do you want to combine actions? Then use this feature. Here, the actions are automatically superimposed in accordance with combination expressions and then displayed as "action combinations". You can define which action combinations will eventually be used for the generation of load or result combinations. Based on the created action combinations, you can estimate how the combination expressions affect the number of combinations.
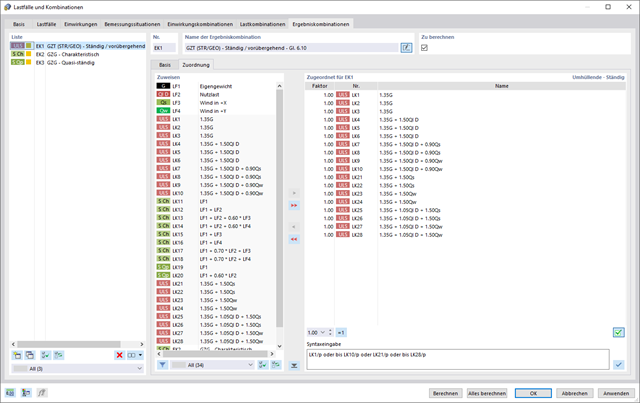
Rely on RFEM 6 even in the case of result combinations. First, you can have the contained load cases calculated in the result combinations. Then, the results are superimposed by taking into account the corresponding factors. In the result combinations, you can superimpose the results of load cases, load combinations, and other result combinations. Internal forces are added together by default. However, you have the option of a square addition, which is relevant for dynamic analysis.
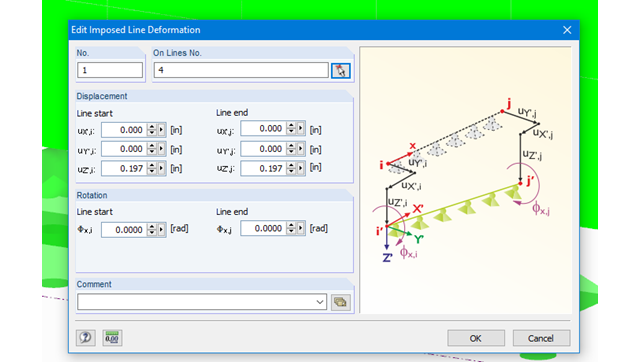
Imposed line deformations can be defined for supported lines in RFEM. For example, foundation settlements can be simulated with this function.
Moreover, it is possible to define imposed rotations for lines.
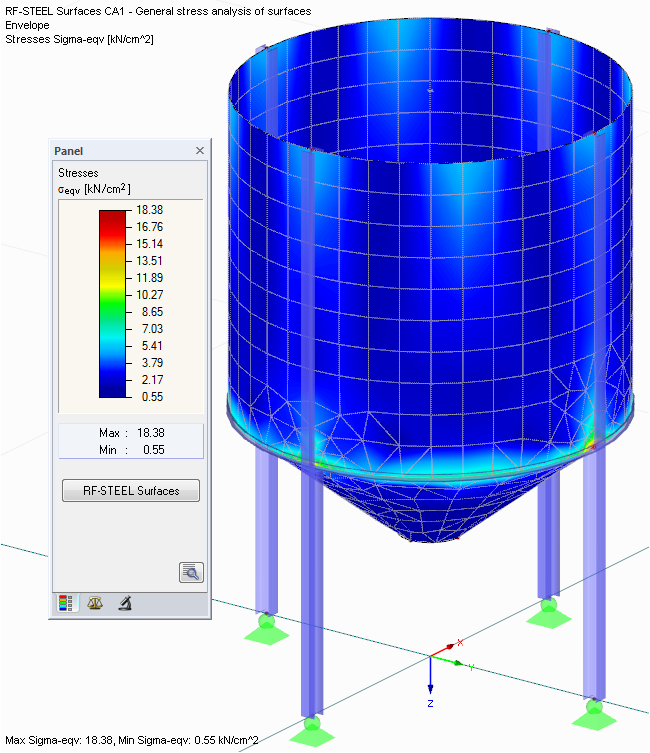
- Determination of principal and basic stresses, membrane and shear stresses, as well as equivalent stresses and equivalent membrane stresses
- Stress analysis for structural surfaces including simple or complex shapes
- Equivalent stresses calculated according to different approaches:
- Shape modification hypothesis (von Mises)
- Shear stress hypothesis (Tresca)
- Normal stress hypothesis (Rankine)
- Principal strain hypothesis (Bach)
- Optional optimization of surface thicknesses and data transfer to RFEM
- Serviceability limit state design by checking surface displacements
- Detailed results of individual stress components and ratios in tables and graphics
- Filter function for surfaces, lines, and nodes in tables
- Transversal shear stresses according to Mindlin, Kirchhoff, or user-defined specifications
- Parts list of designed surfaces
- General stress analysis
- Graphical and numerical results of stresses and stress ratios fully integrated in RFEM
- Flexible design with different layer compositions
- High efficiency due to few entries required
- Flexibility due to detailed setting options for basis and extent of calculations
- A local overall stiffness matrix of the surface in RFEM is generated on the basis of the selected material model and the layers contained. The following material models are available:
- Orthotropic
- Isotropic
- User-defined
- Hybrid (for combinations of material models)
- Option to save frequently used layer structures in a database
- Determination of basic, shear, and equivalent stresses
- In addition to the basic stresses, the required stresses according to DIN EN 1995-1-1 and the interaction of those stresses are available as results.
- Stress analysis for structural surfaces including simple or complex shapes
- Equivalent stresses calculated according to different approaches:
- Shape modification hypothesis (von Mises)
- Shear stress hypothesis (Tresca)
- Normal stress hypothesis (Rankine)
- Principal strain hypothesis (Bach)
- Calculation of transversal shear stresses according to Mindlin or Kirchhoff, or user-defined specifications
- Serviceability limit state design by checking surface displacements
- User-defined specifications of limit deflections
- Possibility to consider layer coupling
- Detailed results of individual stress components and ratios in tables and graphics
- Results of stresses for each layer in the model
- Parts list of designed surfaces
- Possible coupling of layers entirely without shear
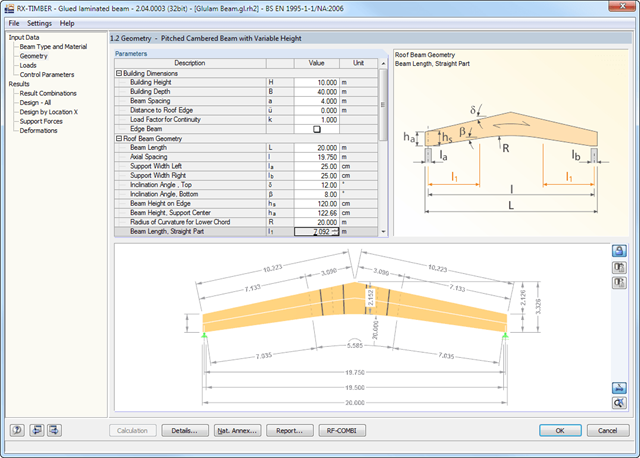
There are various options available for modeling a roof. Graphical representations facilitate the geometry input. Modifications are updated automatically.
In addition, it is possible to consider cross‑section weakening on supports. Optionally, you can define if the design of support pressure on the rafter side should be performed.
Permanent loads (for example, roof structure) can be entered using the comprehensive and extensible material library. Loads due to cantilevers and collars/ties can be entered separately. Generators integrated in RX-TIMBER Purlin allow for convenient generation of various wind and snow load cases. You can manually add any concentrated and distributed loads.
Load cases are displayed graphically and superimposed in automatically generated load combinations according to EC 5. For stability and serviceability limit state designs, you can change the data manually, for example, for example, for cantilevers (roof overhang), it is necessary to ignore the SLS.
The load cases included in the result combinations are calculated first. Then, the results are superimposed by taking into account the corresponding factors. In the result combinations, you can superimpose the results of load cases, load combinations, and other result combinations. Internal forces are added together by default. However, there is the option of a square addition, which is relevant for dynamic analysis.
The actions are automatically superimposed in accordance with combination expressions and then displayed as "action combinations". It is possible to define which action combinations will eventually be used for the generation of load or result combinations. Based on the created action combinations, you can estimate how the combination expressions affect the number of combinations.
All results are arranged in result windows sorted by different topics. The design values are illustrated in the corresponding cross-section graphic. The design details cover all intermediate values.
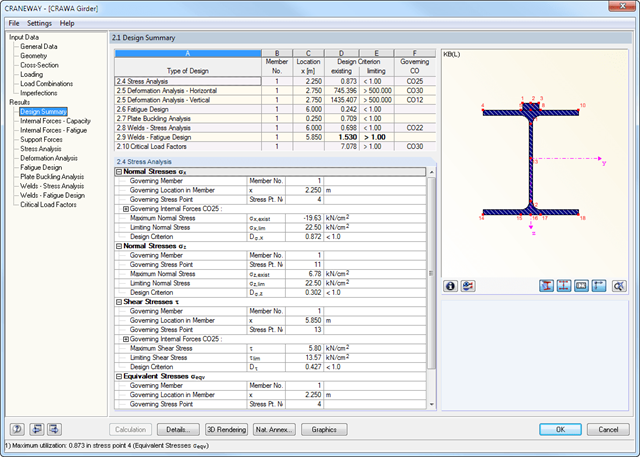
General Stress Analysis
CRANEWAY performs the general stress analysis of a craneway girder by calculating the existing stresses and comparing them with the limit normal, limit shear, and limit equivalent stresses. Welds are also subjected to the general stress analysis with regard to parallel and vertical shear stresses and their superposition.
Fatigue Design
Fatigue design is performed for up to three cranes operating at the same time, based on the nominal stress concept according to EN 1993-1-9. In the case of fatigue design according to DIN 4132, a stress curve of crane passages is recorded for each stress point and evaluated according to the Rainflow method.
Buckling Analysis
Buckling analysis considers the local introduction of wheel loads according to the EN 1993-6 or DIN 18800-3 standards.
Deformation,
Deformation analysis is performed separately for the vertical and horizontal directions. The available related displacements are compared to the allowable values. You can specify the allowable deformation ratios individually in the calculation parameters.
Lateral-torsional buckling analysis
The lateral-torsional buckling analysis is performed in accordance with the second-order analysis for torsional buckling considering imperfections. The general stress analysis has to be fulfilled with the critical load factor greater than 1.00. As a result, CRANEWAY displays the corresponding critical load factor for all load combinations of the stress analysis.
Support forces
The program determines all support forces on the basis of the characteristic loads, including dynamic factors.
- Creation of a pre-deformed FE mesh in RFEM
- Generation of equivalent imperfections of members as equivalent loads, considering
- the reduction factors αu and αm (Eurocode)
- the precamber rises according to buckling stress curves
- Deformation of the structure due to nodal displacement
- Generation of imperfections in accordance with:
- the load case deformations
- the buckling shapes from RF-STABILITY/RSBUCK
- Equivalent imperfections on members and sets of members (for example, columns consisting of several members)
- Visualization of generated imperfection modes
The equivalent load analysis calculation generates load cases and result combinations. The load cases include the generated equivalent loads, which are subsequently superimposed in result combinations. First, the modal contributions are superimposed with the SRSS or CQC rule. Signed results based on the dominant mode shape are possible.
Afterwards, the directional components of earthquake actions are combined with the SRSS or the 100% / 30% rule.
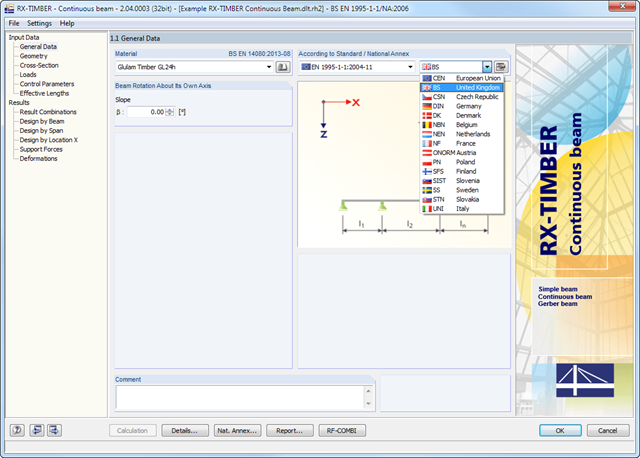
There are various options available for beam modeling. Graphical representations facilitate the geometry input. Modifications are updated automatically. Deflection of cantilevers can be set in the serviceability limit state design, independently of the deflection in the span.
In order to enter permanent loads (for example, roof structure), you can use a comprehensive and extensible material library. Generators integrated in RX-TIMBER Purlin allow for convenient generation of various wind and snow load cases.
Load cases are displayed graphically and superimposed in automatically generated load combinations according to EC 5. This way, the required input data are reduced to a minimum. However, you can enter load specifications manually as well.
There are various options available for beam modeling. Graphical representations facilitate the geometry input. Modifications are updated automatically. Deflection of cantilevers can be set in the serviceability limit state design, independently of the deflection in the span.
The relevant timber grade of the material can be selected from the material library. All material grades specified in EN 1995-1-1: 2004 (EC 5) or DIN 1052:2008-12 and the selected National Annex are available for glulam, hardwood, and softwood timber. Furthermore, it is possible to generate a strength class with user-defined material properties in order to extend the library. Permanent loads (for example, roof structure) can also be entered using the comprehensive and extensible material library.
Generators integrated in RX-TIMBER Purlin allow for convenient generation of various wind and snow load cases. Load cases are displayed graphically and superimposed in automatically generated load combinations according to EN 1990, DIN 1055-100, or DIN 1052. This way, the required input data are reduced to a minimum. However, you can enter load specifications manually as well.
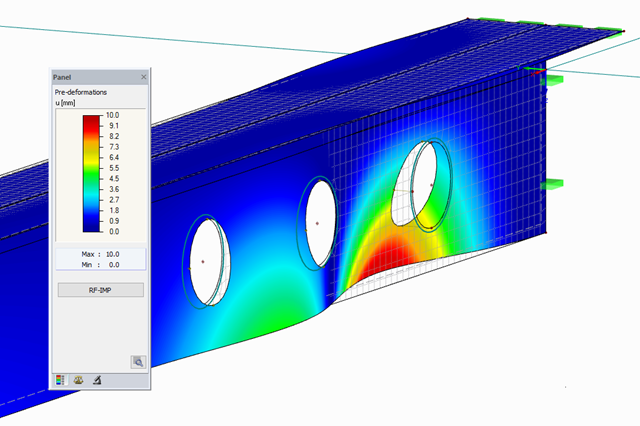
When generating a pre-deformed FE mesh in RFEM, the displacement data of each individual node are saved in the background. This can be used for the calculation of load combinations in RFEM. In order to check the generated data, the pre-deformation is displayed in tables and graphically.
If the nodes of the model are to be displaced, the node coordinates are modified directly after the generation. When generating equivalent imperfections, the module creates a normal load case, including member imperfections. To facilitate the data check, generated imperfections are displayed in result tables as well as graphically.
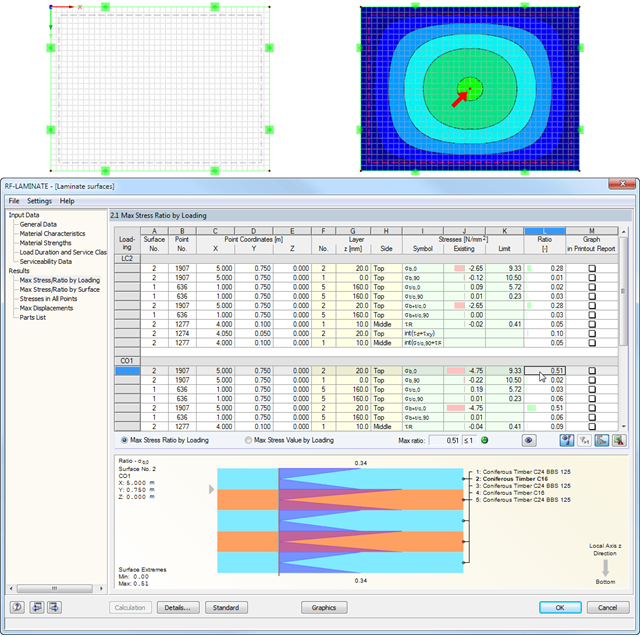
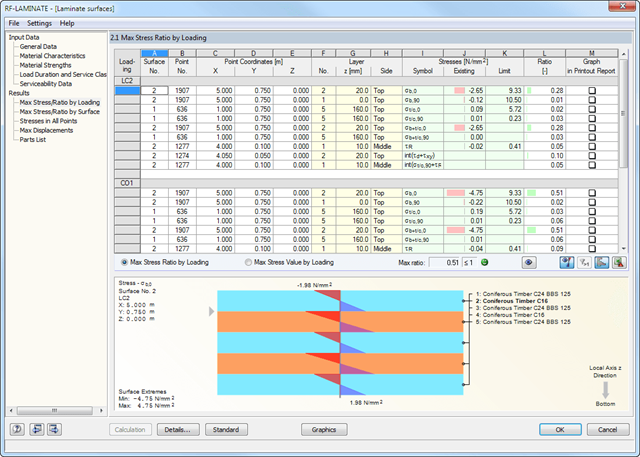
After the calculation, the maximum stresses, stress ratios, and displacements are displayed by load case, surface, or grid points. The design ratio can be related to any kind of stress type. The current location is highlighted by color in the RFEM model.
In addition to the result evaluation in tables, it is possible to display the stresses and stress ratios graphically in the RFEM work window. For this, you can adjust the colors and values assigned in the panel.
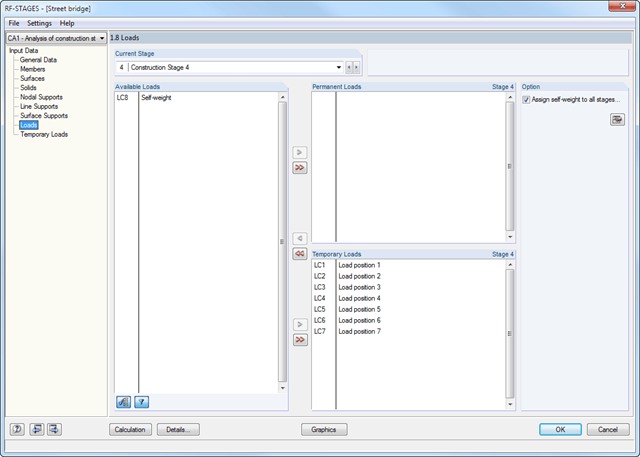
After creating the entire structure in RFEM/RSTAB, the individual structural components as well as load cases and combinations are assigned to the corresponding construction stages. For each construction stage, you can modify for example release definitions of members and supports.
Thus, it is possible to model structural modifications, such as those that occur when bridge girders are successively grouted or when columns are settled. The load cases and load combinations already created in RFEM/RSTAB are divided into "Permanent Loading" and "Temporary Loading" in the add-on module.
The defined temporary loads are superimposed by permanent loads. This way, it is possible to determine the maximum internal forces of different crane positions or to consider temporary mounting loads available only in one construction stage.